

 Date of publication:
  Time to read:
  Views:
 In the previous part about the descending wedge in trading, we analyzed the technical component of this pattern and what it means for traders. In this part we will move on to the practical component and consider how this pattern can be used in trading.
How to build a strategy based on a wedge
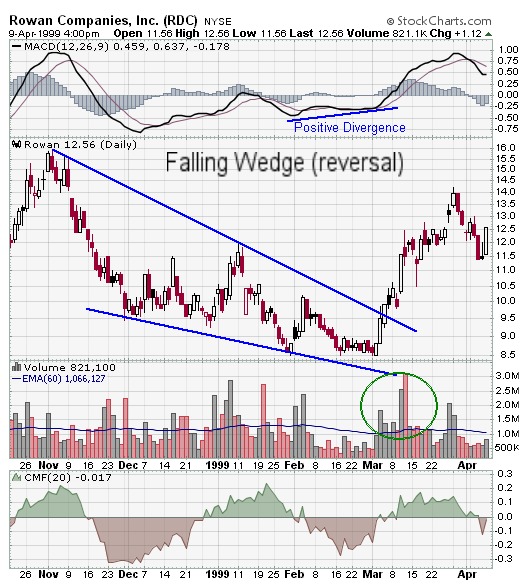
The first step of the strategy is to know how to build a wedge on the chart.The next stage of the strategy is to determine the conditions for entering a trade. The main signal is when the price goes beyond the upper boundary of the wedge. This is the moment when it is important for the trader to recognize the descending wedge, because it is here that a new upward impulse begins. However, do not enter immediately after touching the resistance line: it is necessary to wait for confirmation, which can be an increase in trading volume, the formation of a bullish candlestick pattern or a confident closing above the resistance line.
It is important to provide for position protection. In practice, this means placing a stop loss just below the lower boundary of the figure. Such placement allows you to avoid large losses in case of a false breakout - a situation when the price briefly breaks out of the wedge, but then sharply returns back. This is especially common in the cryptocurrency market, where price manipulation is commonplace.
Successful pattern strategies also include profit targets. Usually, the first target is the distance from the widest part of the wedge, set back from the breakout point upwards. The second target can be determined by key resistance levels or liquidity zones. These are the elements used in systematic automatic trading on figures, where the logic of entry and exit is predetermined in the algorithm. That said, it is important to understand whether you go to take a quick scalp or hold a position long term.
To increase efficiency, a strategy based on the wedge can be reinforced with indicators. For example, if a descending wedge on an uptrend is accompanied by a bullish RSI divergence, it increases the chances of a successful breakout. Many traders combine the wedge with Fibonacci levels, EMAs, and volume zones.
Tools like trading bots are suitable for such tasks, which allow you to automate the search for wedges, track signals, identify confirmations and execute trades in automatic mode. The use of such solutions within the framework of wedge trading helps to exclude emotions and adhere to strictly defined logic.
It is also important to take into account the general direction of the market. If the whole market is in the growth phase, the breakdown of a descending wedge can lead to a powerful upward movement. However, if the wedge is formed within a larger downtrend, its breakout may be short-term, and the strategy should provide for quick profit taking. Remember - the global context always dominates the local context.
Combining a descending wedge with indicators
To increase the reliability of analysis, chart patterns are often combined with indicators. For example, when a falling wedge is formed on the background of RSI or MACD divergence, the probability of reversal increases significantly. Traders working with trading bots can integrate the signals of the pattern with the indicators of technical indicators, automating the filtering of false signals.
Another popular approach is to match the figure with the trend. If a descending wedge is formed on an uptrend, it may simply be a phase of correction before the upward movement continues. It is important to distinguish this figure from the pattern “descending triangle”, which more often indicates a continuation of the fall.
The ability to recognize a descending wedge in real time is one of the main skills of a successful trader. Volume indicators help here: volume decreases when approaching the end of the wedge, and rises sharply at the moment of breakout. This is a classic scenario, which is well tracked by bots that use automatic figure trading.
Common mistakes and how to avoid them
Despite the popularity and simplicity of the descending wedge pattern, many traders make mistakes when using it, which reduces the effectiveness of strategies and can lead to losses. In order to use the descending wedge pattern in trading as effectively as possible, it is important to know what traps are most common and how to avoid them.
One of the most typical mistakes is the incorrect construction of the figure. Beginning traders often do not know how to build a wedge on a chart and end up connecting the wrong points, which leads to distortion of the shape. As a result, it is possible to confuse a falling wedge with other chart patterns and suffer unplanned losses.
The second common mistake is premature entry before the breakout is confirmed. Many traders rush to buy when the price is close to the upper boundary of the wedge without waiting for a confident breakdown of the descending wedge. As a result, they fall into a false breakout, when the price only briefly goes beyond the figure and then sharply turns downward. Volume analysis helps to avoid this mistake: the growth of trading volume on a breakdown is an important sign of its authenticity.
The third mistake is ignoring the market context. A pattern does not exist in a vacuum. For example, a descending wedge in an uptrend may simply mean a temporary correction before continuing to grow, while the same pattern in a strong downtrend may only lead to a short-term pullback. Hence the importance of analyzing the chart in conjunction with the fundamental and news background.
The fourth mistake is trading without a clear plan and risk management. Even if the reversal pattern has worked out correctly, a trader can lose profit due to the lack of predetermined entry levels, stop loss and take profit.
The fifth mistake is confusion between ascending and descending wedges. Although both patterns belong to the wedge trading category, they give opposite signals. An ascending wedge most often portends a decline, especially if it is formed against the background of weakening bullish momentum. A descending wedge, on the contrary, signals a possible growth. An erroneous interpretation can lead to entering a deal against the trend.
Finally, the sixth mistake is ignoring automation. In a fast market, manual analysis may not keep up with the changes. Using trading bots allows you to quickly find many technical patterns, including the descending wedge pattern, check the conditions and enter the deal according to the set criteria. This is especially important when seconds count and a mistake can be costly.
This is the end of the review of the descending and ascending wedge in crypto trading, stay tuned to our blog for new and useful materials on trading and automation!
FAQ
1. What happens after a falling wedge pattern?
As a rule, after an upward breakout, the price rises rapidly. This is a classic trend reversal signal, especially if confirmed by volumes.
2. What is the difference between a descending wedge and a descending triangle?
A descending triangle pattern usually portends a continuation of a decline, while a descending wedge in trading is a signal of a possible reversal.
3. can I use a bot to trade a wedge?
Yes, wedge trading bot and other solutions such as Veles bot technical analysis are great for analyzing and automating trades on this pattern.
4. How to avoid false breakouts?
Watch for signal confirmation - volume, candlestick patterns and movement after the breakout. A false breakout is often accompanied by a quick price return inside the pattern.
5. Does the descending wedge work on all timeframes?
Yes, but the efficiency is higher on the older timeframes - from 4H and higher. On shorter timeframes the probability of noise and false signals increases.

 Get $5 to launch a bot
 Learn how cryptocurrencies and trading bots work
 Start small and appreciate the benefits